University of Bayreuth – Press Release No. 073/2026, 22. September 2026
Greenland is shrinking, Africa is growing: Bayreuth-based software reveals map distortion
The UN General Assembly recommends area-preserving world maps. An extension to the JSXGraph software, developed at the University of Bayreuth, demonstrates in a web browser the effects that different map projections have on the relative sizes of the continents.
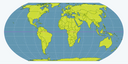
Equal-Earth-Projection
CMLDT Universität Bayreuth
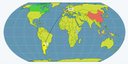
Equal-Earth-Projection with flight route
CMLDT Universität Bayreuth
Why it matters?
World maps shape our view of the Earth, but they do not always show the world to scale. A new geo-extension for the open-source software JSXGraph, developed at the University of Bayreuth, makes the effects of different map projections visible directly in the web browser. Users can switch between different representations and compare them with an interactive globe. This clearly illustrates why Greenland appears almost as large as Africa on some maps, even though the African continent is in fact many times larger. The application supports science communication, digital teaching and e-learning programmes, whilst also highlighting the fundamental mathematical and geographical principles behind the representation of our world.
A new geo-extension for the open-source software JSXGraph developed at the University of Bayreuth demonstrates in a web browser just how much world maps can distort the actual relative sizes of continents. Users can switch between different map projections directly in the web browser and compare their effects using an interactive globe.
The issue has gained current relevance following the ‘Correct the Map’ resolution, which was adopted by a large majority at the United Nations General Assembly on 4 September 2026. The resolution recommends the use of area-preserving world maps wherever proportions are important, while also calling for greater public awareness of the inevitable distortions caused by map projections. A well-known example illustrates just how significant these differences can be: on the widely used Mercator map, Greenland appears almost as large as Africa. In reality, Africa is fourteen times larger.
The new software extension was developed by the Chair of Mathematics and its Didactics in collaboration with the Centre for Mobile Learning with Digital Technology (CMLDT) at the University of Bayreuth. With just a few clicks, different map projections can be compared. The displays change seamlessly, immediately illustrating the respective advantages and disadvantages: while the Mercator projection accurately represents angles, it distorts areas considerably. Area-preserving projections such as Equal Earth, on the other hand, preserve proportions but accept changes to the contours as a trade-off.In addition, an interactive, rotatable globe is available. This illustrates why no flat map of the world can depict Earth’s surface without distortion.
“At its core, a map projection is nothing more than a representation of the spherical surface onto a plane,” says Dr. Carsten Miller, Managing Director of the CMLDT. “A globe, on the other hand, involves the perspective representation of a spherical model. We deal with such geometric questions in mathematics. I am a mathematician, not a geographer: for me, a map is first and foremost a representation.”
The extension is not intended as specialist cartographic software, but rather as a tool for illustrating geographical and mathematical relationships. At the same time, it demonstrates the capabilities of JSXGraph, a globally used open-source library for interactive geometry, function graphs and data visualisation in web browsers. The development team envisages potential applications primarily in science communication, on websites, and in schools and universities. Maps and globes can be integrated into digital platforms with just a few lines of code. Furthermore, the extension opens up new possibilities for digital learning and e-assessment. For example, learners can mark countries, routes or regions directly on a map; the entries can then be automatically evaluated.
Beyond visualisation, a second area of application emerges: e-assessment. JSXGraph itself is also used in examination and exercise systems. Because the extension returns evaluable values for every interaction, it is possible to create tasks that can be assessed automatically. Learners click on a country, draw a route or outline an area; depending on the task, the system can also mark the answer itself within a specified tolerance. Like JSXGraph, the extension is available under a dual licence: either the GNU Lesser General Public Licence (LGPL) or the MIT Licence. This is the first release; its limitations are documented, and further developments are planned: additional datasets, finer resolutions and further map projections. Feedback from relevant academic disciplines and practitioners is expressly welcome.
Source: UN-Resolution https://docs.un.org/en/A/RES/80/307
Links:
Try out the maps and globe for yourself
https://jsxgraph.org/extensions/geo/demo/
Documentation and examples of the JSXGraph extensions
https://jsxgraph.org/extensions/geo/
Project JSXGraph
https://jsxgraph.org

Dr. Carsten MillerExecutive Director of the Center for Mobile Learning with Digital Technology (CMLDT)
University of Bayreuth
University of Bayreuth
Phone: +49 (0)921 / 55-3268
E-Mail: carsten.miller@uni-bayreuth.de

Dr. Stefan Fehm-DanoglidisPress Spokesperson, University of Bayreuth
Telephone: 0921 / 55-5300
Mobile: 0175 / 355 3973
email: stefan.fehm-danoglidis@uni-bayreuth.de